Assessment Data Tables
Inspect raw, cleaned and standardised results for each of the six assessment tables. The preprocessing workflow supplies the selected DataFrame to the interface.

A Python assessment data pipeline and monitoring system, built for comparisons across tests.
Programming Fundamentals / January 2026
This programming project cleans and standardises assessment results, stores them in SQLite and presents student performance across formative and summative tests.
A preprocessing class manages loading, cleaning, standardising and storage. Analysis modules compare an individual student with class averages, combine results across assessments and identify students below the summative lower quartile.
Question counts and maximum scores are derived from the assessment data rather than hard-coded, so the processing can accommodate different test structures.
Inspect raw, cleaned and standardised results for each of the six assessment tables. The preprocessing workflow supplies the selected DataFrame to the interface.
Enter a student ID to retrieve a combined table of results across tests and an overall grade graph.
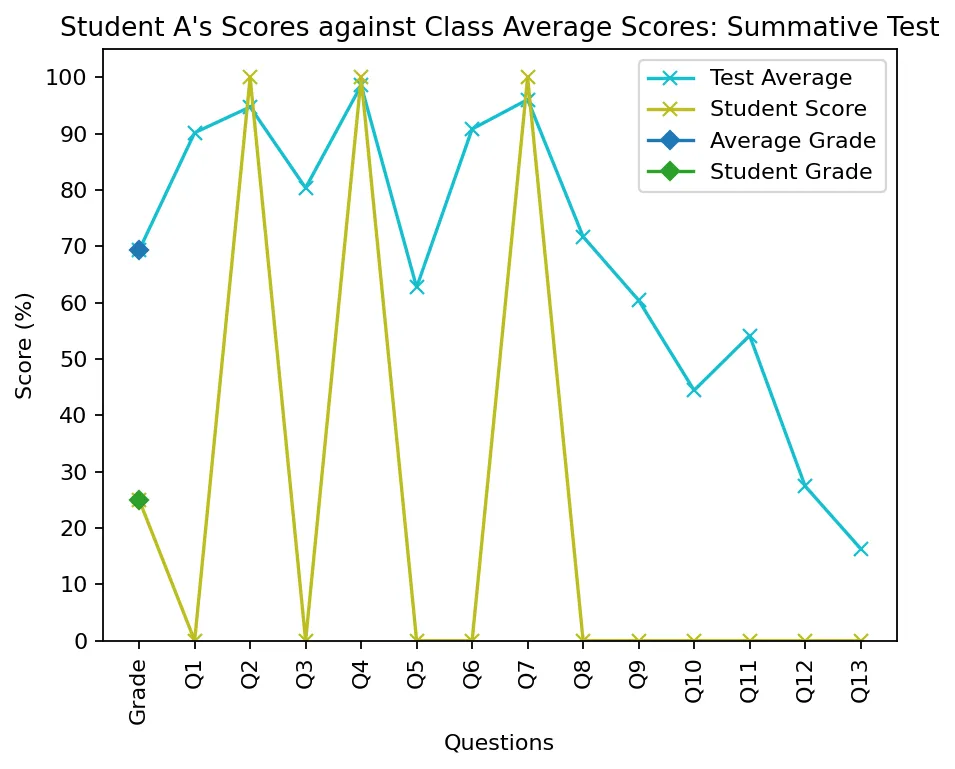
Select a student and test to compare question scores with class averages. Navigation carries the student ID between results and performance views.
Review students below the summative lower quartile, their formative grades, a summative boxplot and individual formative charts.
The original interface is built with ipywidgets in Jupyter. The application below includes all four workflows, with student lookup and connected views.
A browser adaptation of the submitted Jupyter application, using outputs from the original Python preprocessing pipeline. Coursework student IDs are displayed as aliases.
Loading assessment data…
The processing pipeline
Raw, cleaned and standardised DataFrames are stored in dictionaries keyed by table name. Student analysis draws from the stored results to produce comparative charts and combined result tables.
Underperformance analysis uses the summative lower quartile as a reference point, alongside formative grades and individual charts.
Implementation detail
The notebook manages page navigation and clears previous output to prevent tables and charts from stacking. Dedicated modules handle preprocessing, combined results, student comparisons and underperformance analysis.